Candlestick Pattern Financial Markets में Price Movements को Graphical Form मे Price को Represent करता हैं, जो आमतौर
Counterattack Candlestick Pattern – 90% तक Trend Reversal Possibility होती है
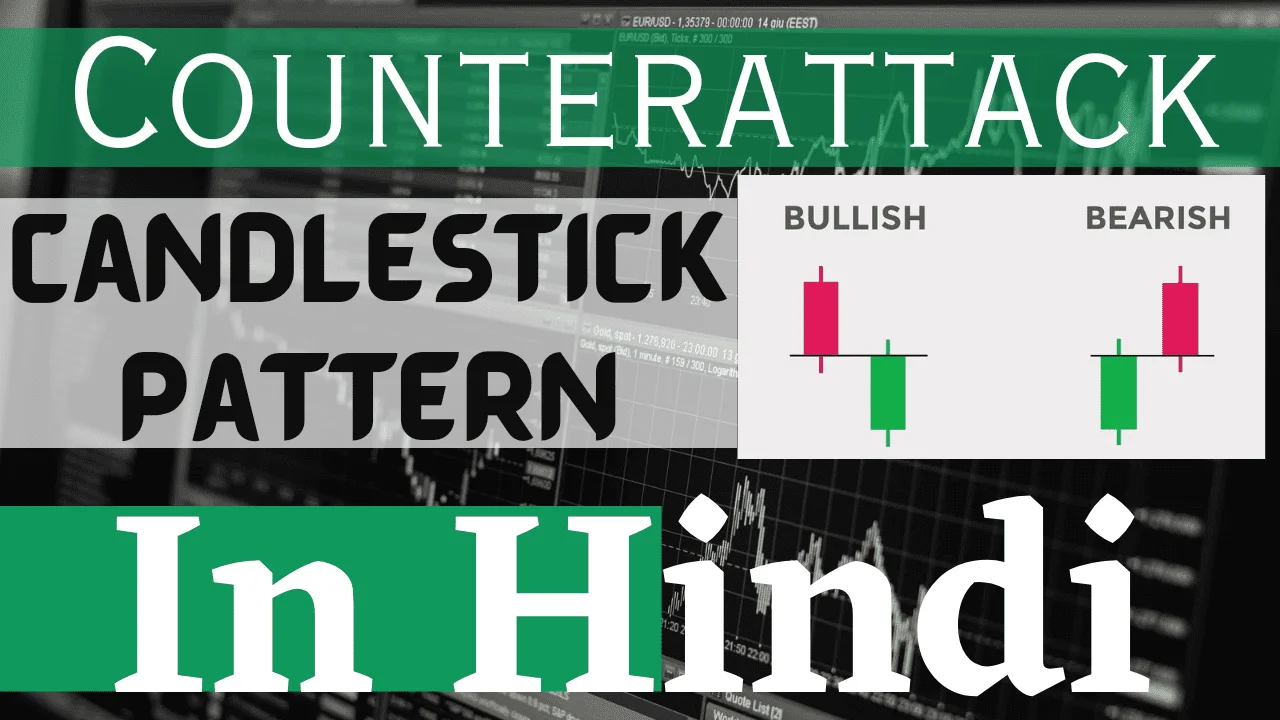
सभी प्रकार के Candlesticks Pattern और Candlesticks Pattern के बनने, Candlestick को कैसे Trade किया जाता है क्या कमिया हो सकती इस पर बात करते है
Candlestick Pattern Financial Markets में Price Movements को Graphical Form मे Price को Represent करता हैं, जो आमतौर

Candlestick Pattern Financial Markets में मुख्य रूप से Technical Analysis में Price Movements को Visual Represent करती हैं।
Candlestick Pattern Financial Markets में Price Movement के Visual को Representation करता हैं। वे Future के Price Trends

Candlestick Pattern Technical Analysis में एक Important Role निभाते हैं, Market की Sentiment और Price Movement की Valuable

Candlestick Pattern Technical Analysis में Important Importance रखते हैं, Market के Movement कि Valuable Insights देती हैं और
Candlestick Pattern Technical Analysis में एक Important Tool है, जो Market के Sentiment और Potential Price Movement की
Candlestick Pattern Financial Markets में Price Movement के Visual Representation के करता हैं कि वे किसी Specific Time

Candlestick Pattern अधिकतर रूप से Technical Analysis में उपयोग किया जाता है, जो Price Movement और Market के

Candlestick Pattern Financial Market में Price Movements के Visual Representation को बताने का काम करते हैं। इसकी खोज
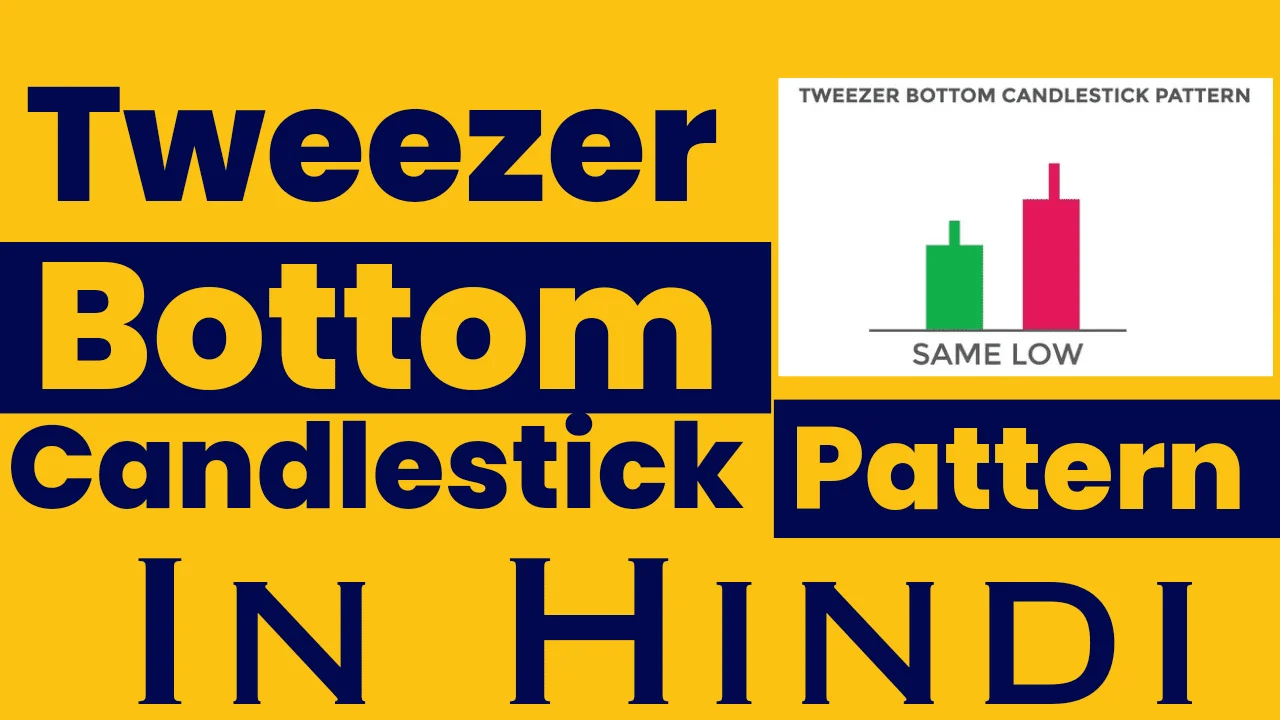
Candlestick Pattern Technical Analysis में Price Action के Visual Representation हैं, जिसमे Tweezer Bottom Candlestick Pattern बहुत Important