CANDLESTICKIDEA.COM

Candlestick Patterns

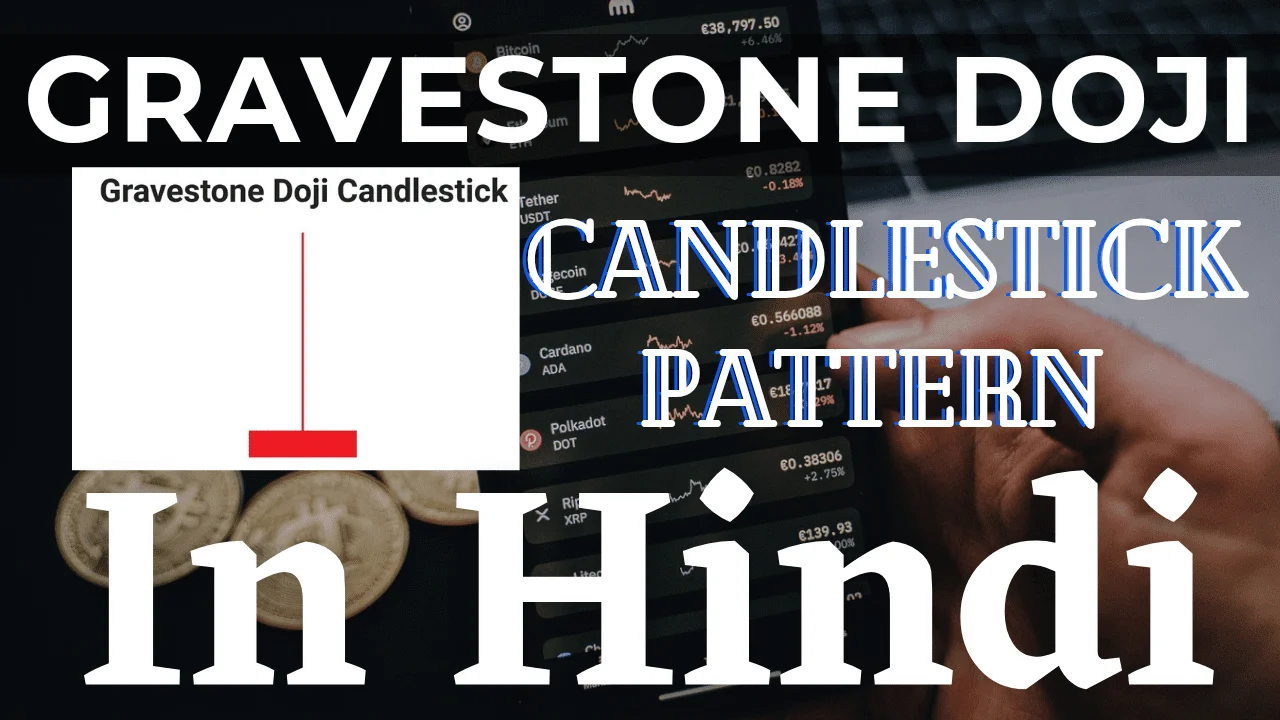
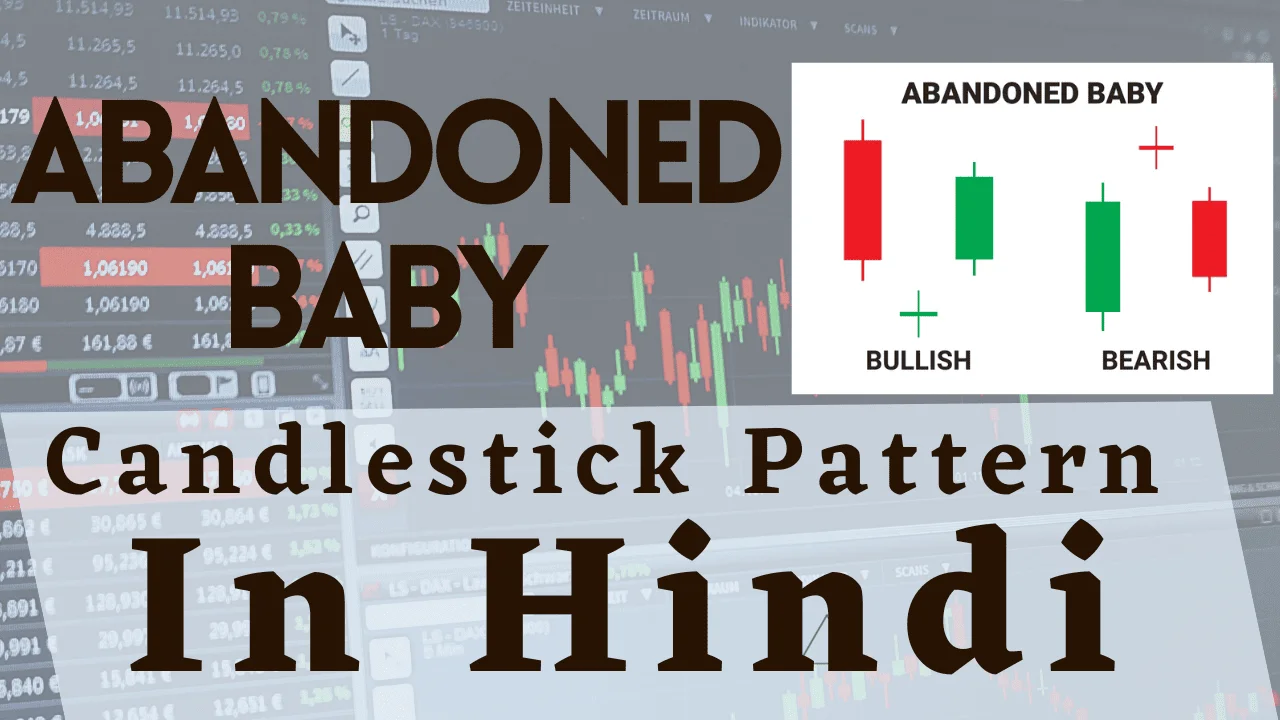
सभी प्रकार के Candlesticks Pattern और Candlesticks Pattern के बनने, Candlestick को कैसे Trade किया जाता है क्या कमिया हो सकती इस पर बात करते है

Dragonfly Doji Candlestick Pattern - 90% Bullish Reversal के Strong Signal देता है

Dragonfly Doji Candlestick Pattern – 90% Bullish Reversal के Strong Signal देता है

Candlestick Pattern Technical Analysis में एक Important Role निभाते हैं क्योंकि वे Market के Sentiment और Potential Price Reversal के लिए Valuable Insights मिलती हैं। विभिन्न Candlestick Pattern में, Dragonfly Doji Candlestick Pattern Important Importance रखता है। Candlestick Pattern की Definition Candlestick Financial Markets में Prices के Ups-Downs का Graphical Representation होता है। इनमें एक …

Dragonfly Doji Candlestick Pattern – 90% Bullish Reversal के Strong Signal देता है Read More »

Long-legged Doji Candlestick Pattern - 80% Trend Reversal कि Strength बताती है

Long-legged Doji Candlestick Pattern – 80% Trend Reversal कि Strength बताती है

Candlestick Pattern Financial Markets में Price Movements के Visual Represent करती हैं, जो आमतौर पर Technical Analysis में उपयोग किए जाते हैं। जो कि Market Psychology कि Valuable Insights देता हैं और Traders और Investors को Historical Price के आधार पर Future के Price का Movement की Prediction करने में सहायता करते हैं । Market …

Long-legged Doji Candlestick Pattern – 80% Trend Reversal कि Strength बताती है Read More »

Belt Hold Candlestick Pattern - बताती 91% Trend बदल सकता है

Belt Hold Candlestick Pattern – बताती 91% Trend बदल सकता है

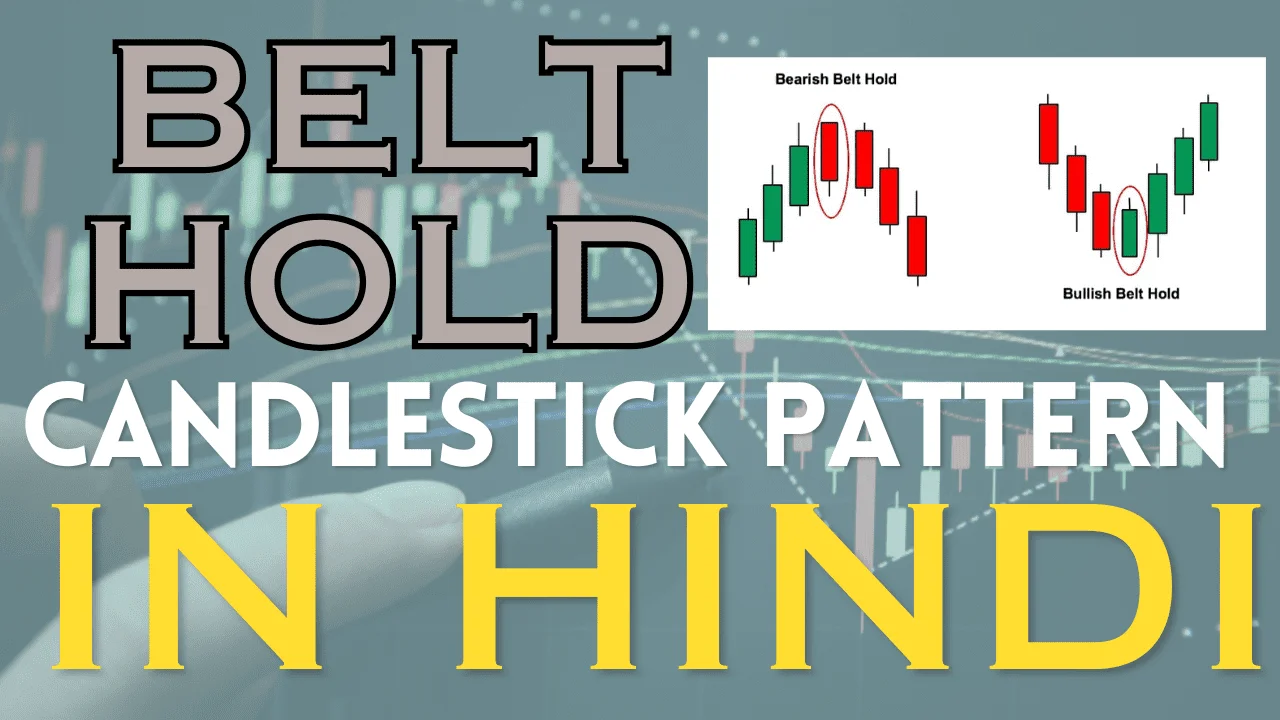
Candlestick Pattern, Belt Hold Candlestick Pattern सहित, Traders को Future की Prices के Ups-Downs की Prediction करने, Market की Strength के बारे जान सकते है और बेहतर Trading Decision लेने की अनुमति देता है। वे हमें यह जानने में मदद कर सकते हैं कि Trade में कब Entry करना है या कब Exit करना है, …

Belt Hold Candlestick Pattern – बताती 91% Trend बदल सकता है Read More »

Abandoned Baby Candlestick Pattern - 95% Strong Signal Trend Reversal के लिए

Abandoned Baby Candlestick Pattern – 95% Strong Signal Trend Reversal के लिए

Candlestick Pattern Financial Markets में Price Movements को Visually Represent करता हैं। Traders Technical Analysis में इन Patterns का उपयोग Market Sentiments कि Valuable Insights को प्राप्त करने और Informative Trading Decision लेने के लिए करते हैं। Candlestick Pattern Technical Analysis में एक Important Role निभाती हैं क्योंकि वे Potential Market में Reversal, Trend Continuation …

Abandoned Baby Candlestick Pattern – 95% Strong Signal Trend Reversal के लिए Read More »

Falling Three Methods Candlestick Pattern - 90% Definitely गिरावट जारी रहेगी

Falling Three Methods Candlestick Pattern – 90% Definitely गिरावट जारी रहेगी

Candlestick Pattern Financial Markets में Price Movements के Visual Represent करती हैं। इनकी खोज Japan में हुए थी और Market के Trends को Analysis और Prediction करने के लिए सदियों से इसका इस्तेमाल किया गया है। Candlestick Chart एक Specific Time Period के लिए किसी Asset की Open, High, Low और Close Prices को Represent …

Falling Three Methods Candlestick Pattern – 90% Definitely गिरावट जारी रहेगी Read More »

Rising Three Methods Candlestick Pattern - 90% Uptrend Strong है जारी रहेगा

Rising Three Methods Candlestick Pattern – 90% Uptrend Strong है जारी रहेगा

Candlestick Pattern विशेष Chart हैं जो दिखाते हैं कि Financial Markets में Price कैसे चल रही हैं। वे आमतौर पर Trading द्वारा Market के Trend को समझने और Smart और सही Desicion लेने के लिए उपयोग किए जाते हैं। Candlestick Pattern सहायक होते हैं क्योंकि वे Price Movements का एक Visual Represent करता हैं। प्रत्येक …

Rising Three Methods Candlestick Pattern – 90% Uptrend Strong है जारी रहेगा Read More »

Dark Cloud Cover Candlestick Pattern - 90% तक Strong Bearish Reversal होगा

Dark Cloud Cover Candlestick Pattern – 90% तक Strong Bearish Reversal होगा

Candlestick Pattern Technical Analysis में Important Importance रखते हैं, Market के Movement कि Valuable Insights देती हैं और Traders को Informative Decision लेने में सहायता करते हैं। Candlestick Pattern को Graphical Formation के द्वारा Represent किया जाता है । ये Pattern, Price Action और Market के Sentiment को Visual के रूप मे दिखाता Represent हैं। …

Dark Cloud Cover Candlestick Pattern – 90% तक Strong Bearish Reversal होगा Read More »

Three Black Crows Candlestick Pattern - 90% Strong Selling आयेगी बताता है

Three Black Crows Candlestick Pattern – 90% Strong Selling आयेगी बताता है

Technical Analysis में Candlestick Pattern एक Important Tool हैं। वे Traders को Future के Price Movement के बारे में Prediction करने के लिए Financial Markets में Price Movement का Analysis करने में मदद करते हैं। ये Pattern Market Sentiment और Trend Reversal का Visual Represent करता हैं। Japan मे खोज कि और दुनिया भर में …

Three Black Crows Candlestick Pattern – 90% Strong Selling आयेगी बताता है Read More »

Three Inside Up Candlestick Pattern - Bullish Reversal के 90% Strong Signal देता है

Three Inside Up Candlestick Pattern – Bullish Reversal के 90% Strong Signal देता है

Candlestick Pattern Financial Markets में Price Movements को Visually Represent करता हैं। Traders Technical Analysis में इन Patterns का उपयोग Market Sentiments कि Valuable Insights को प्राप्त करने और Informative Trading Decision लेने के लिए करते हैं। Candlestick Pattern Technical Analysis में एक Important Role निभाती हैं क्योंकि वे Potential Market में Reversal, Trend Continuation …

Three Inside Up Candlestick Pattern – Bullish Reversal के 90% Strong Signal देता है Read More »

Counterattack Candlestick Pattern - 90% तक Trend Reversal Possibility होती है

Counterattack Candlestick Pattern – 90% तक Trend Reversal Possibility होती है

Candlestick Pattern Financial Markets में Price Movements को Graphical Form मे Price को Represent करता हैं, जो आमतौर पर Technical Analysis में उपयोग किए जाते हैं। वे Market के Sentiment और Future के Potential Price Trends कि Valuable Insights देता हैं। एक Candlestick 4 मुख्य Part से बनता होता है। एक Specific Time Period के …

Counterattack Candlestick Pattern – 90% तक Trend Reversal Possibility होती है Read More »

Scroll to Top