Chart Pattern Technical Analysis में Important Role निभाते हैं, जो Market Analysis को Visually Representation करता हैं। वे
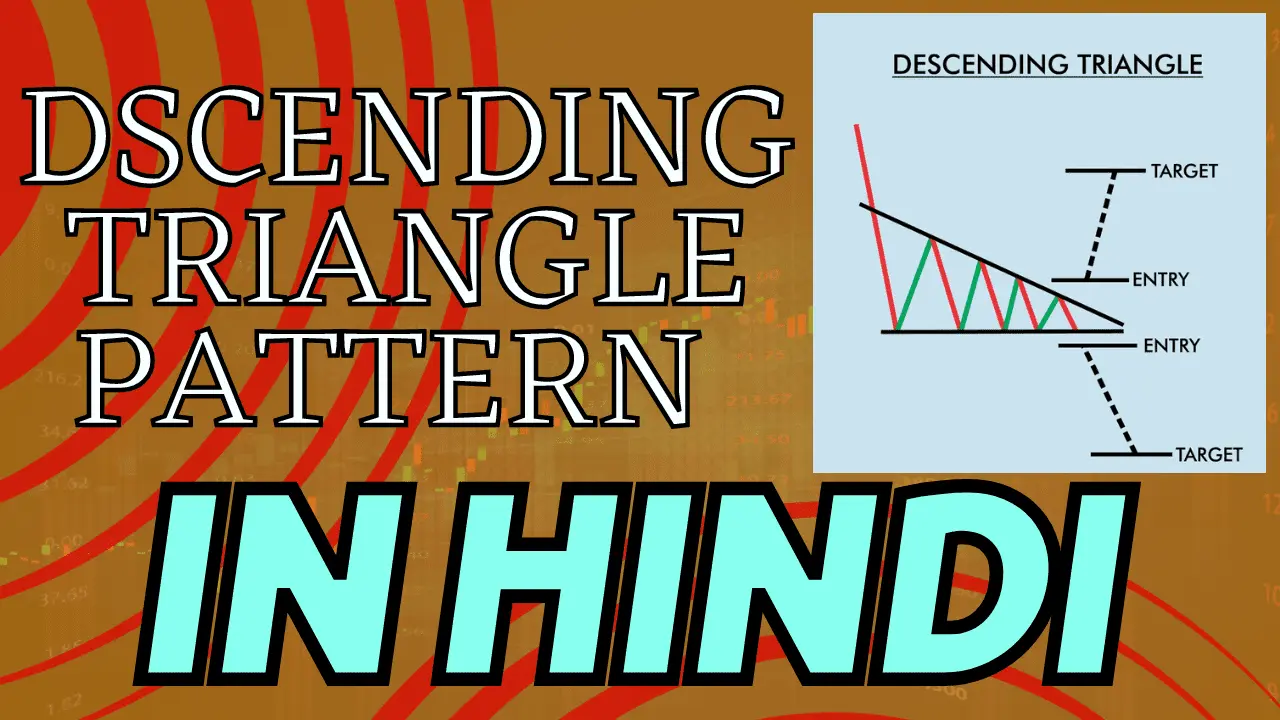
Descending Triangle Pattern – Trend 80% जारी रह सकता है


Chart Pattern Technical Analysis में Important Role निभाते हैं, जो Market Analysis को Visually Representation करता हैं। वे

Head and Shoulders Pattern Technical Analysis में एक Important Chart Pattern है जो Potential Trend Reversal का Signal

Chart Pattern Technical Analysis में Important Role निभाता हैं क्योंकि वे Traders और Investors को Market के Trend

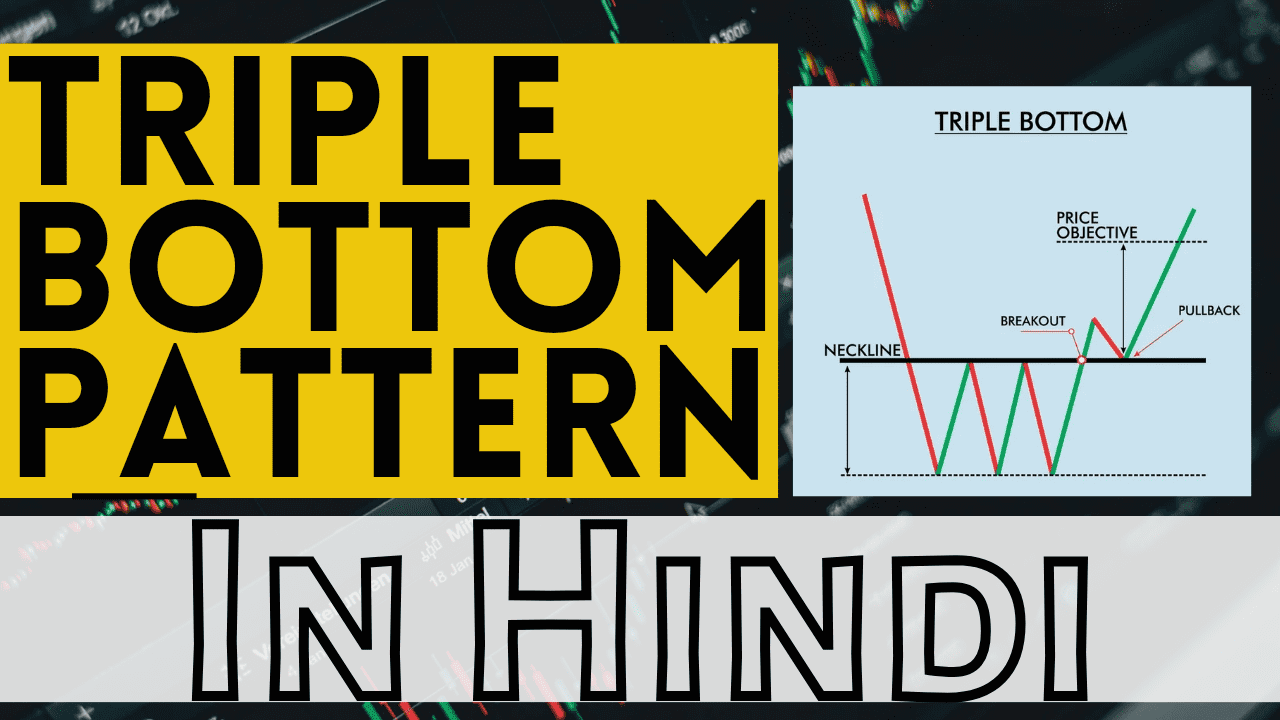
Triple Bottom Pattern एक Popular Chart Pattern है जिसका उपयोग Financial Markets में Potential Trend Reversal की पहचान

Chart Pattern Technical Analysis में एक Important Role निभाते हैं, जो Market के Trend और Potential Price Movements

Technical Analysis में Chart Pattern एक Important Tool हैं, जो Traders को Potential Price Movement के बारे में
