पिछले कुछ अध्यायों में हमने विभिन्न Chart Pattern के बारे में बात की थी, जैसे Candlestick Pattern, Triangle
Pennant Chart Pattern In Hindi | पताका चार्ट पैटर्न कि पूरी जानकरी (A to Z)
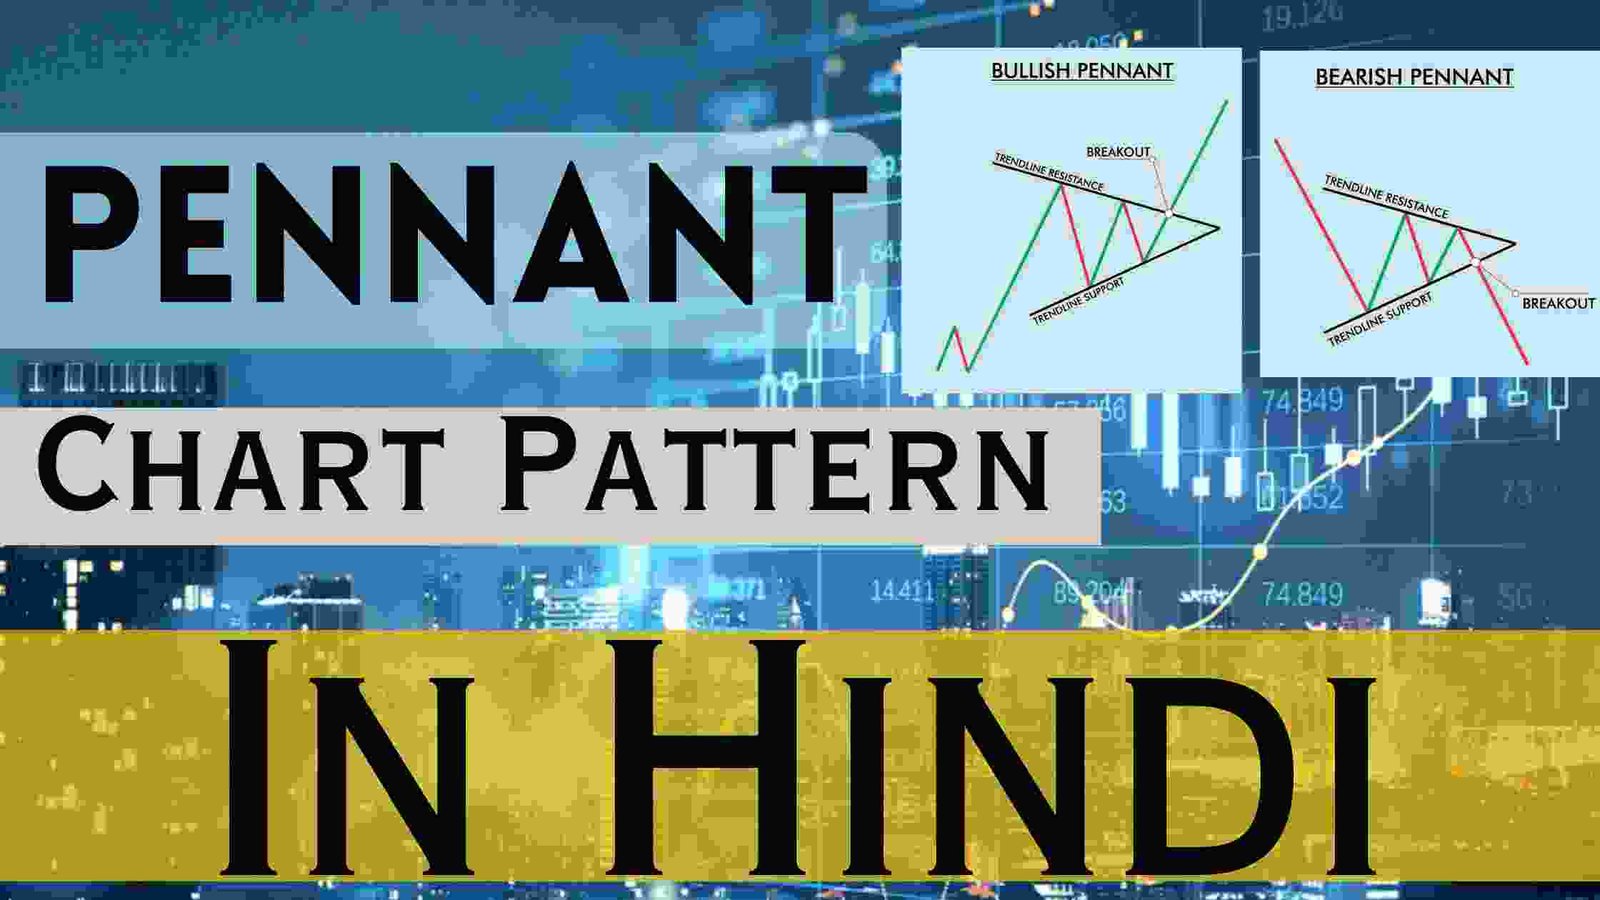

पिछले कुछ अध्यायों में हमने विभिन्न Chart Pattern के बारे में बात की थी, जैसे Candlestick Pattern, Triangle
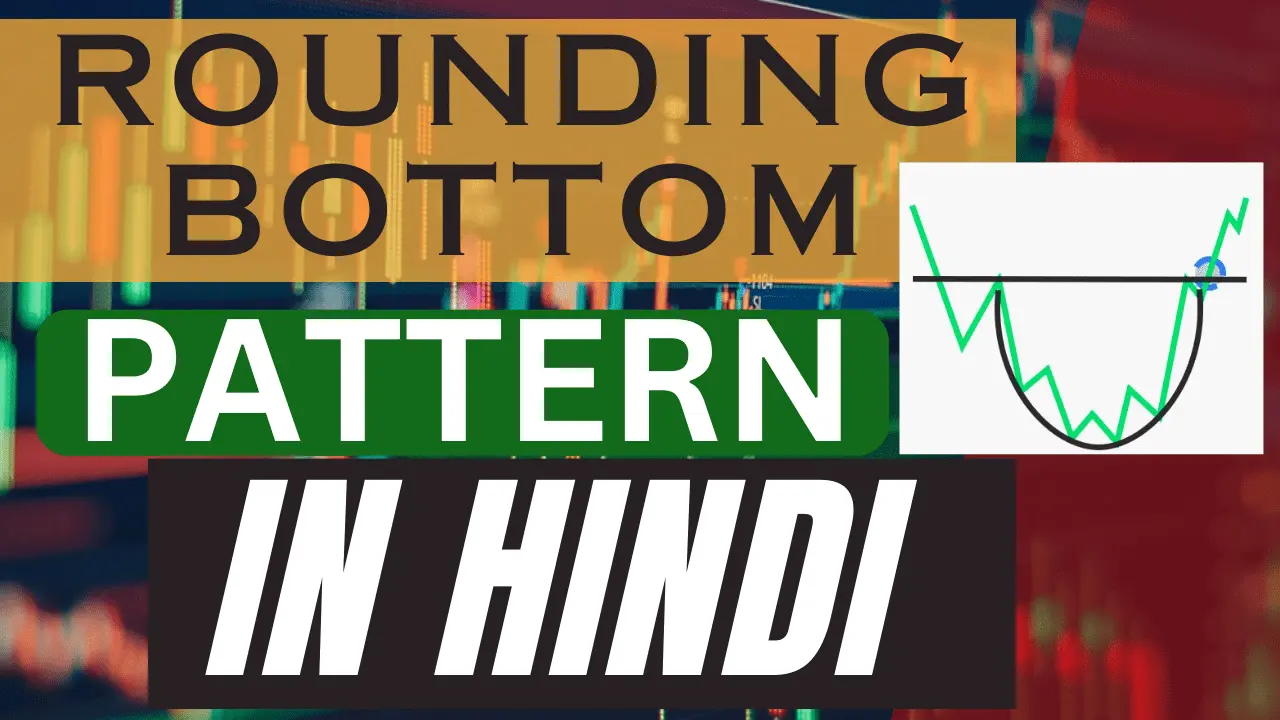
Financial Markets में Traders और Investors को Price Movement को समझने में Chart Pattern Important Role निभाते हैं।

Symmetrical Triangle Pattern एक Important Chart Pattern होता है जिसको ज्यादातर Financial Markets मे देखा जाता है और
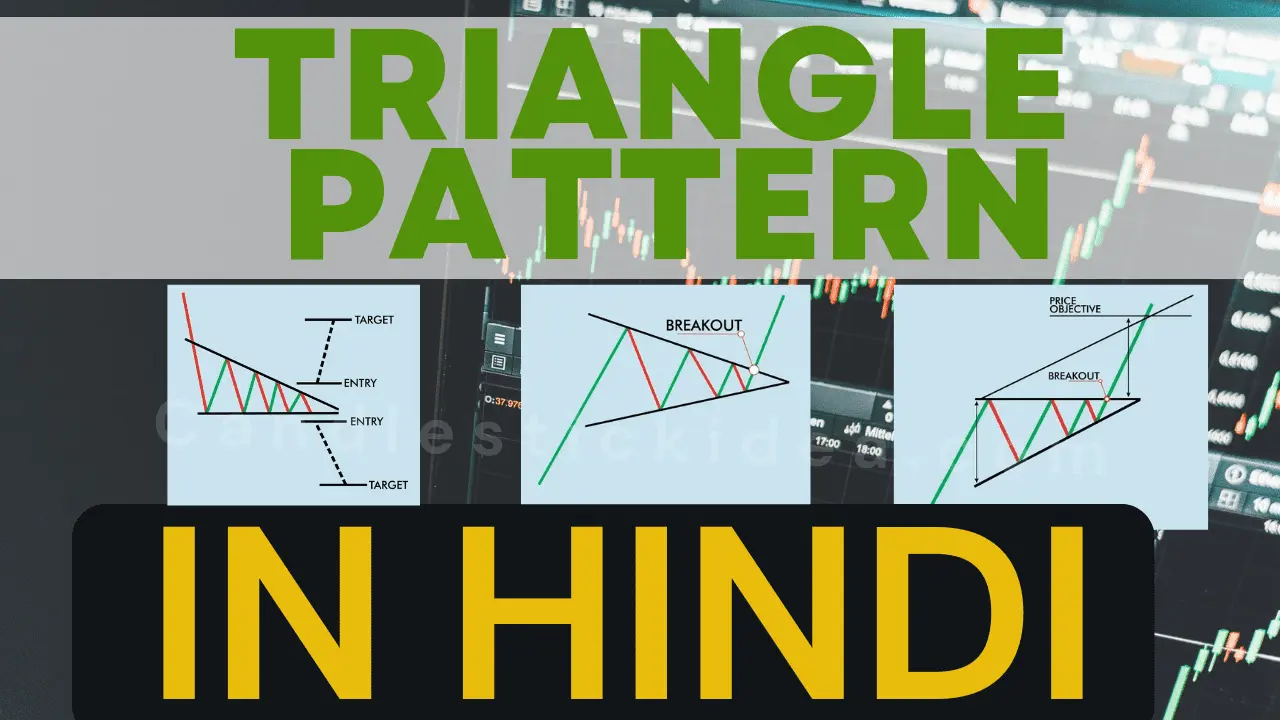
Financial Markets और Technical Analysis की दुनिया में, Chart Pattern Traders और Investors के लिए Informative Desicion लेने
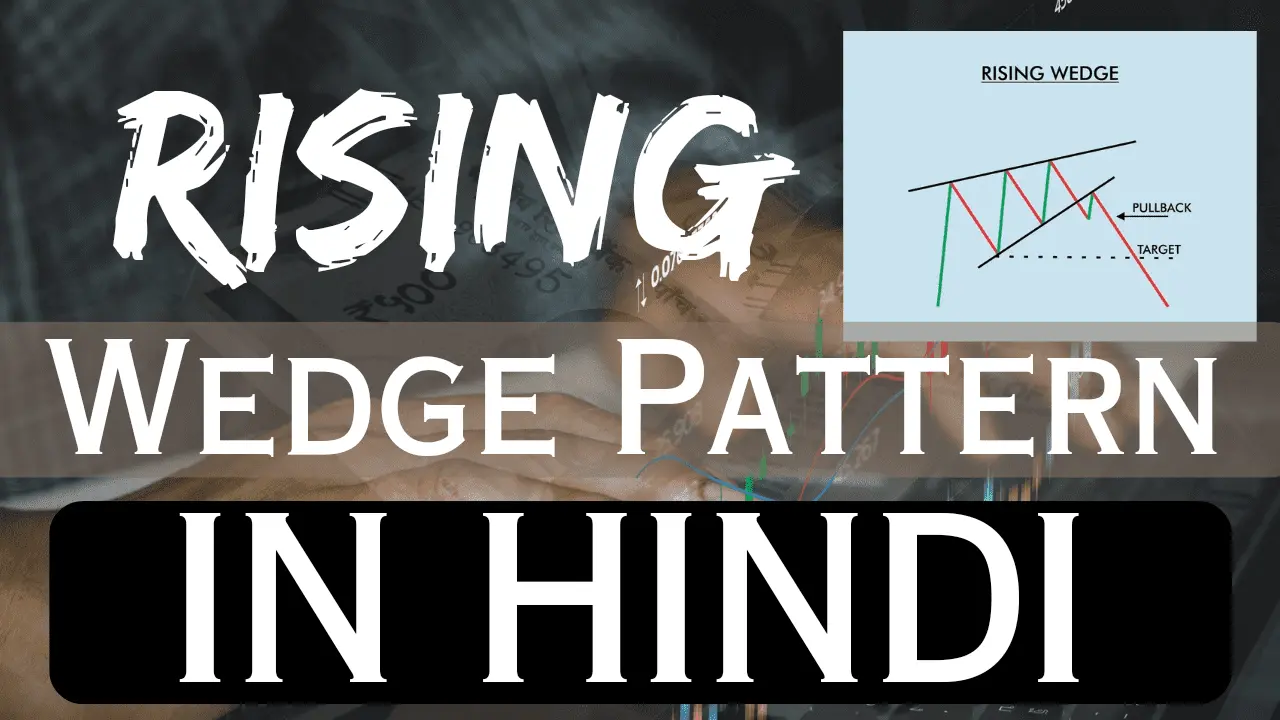
Financial Markets और Technical Analysis में, Chart Pattern Traders और Investors वो जानकरी देते जिससे Strong Decision लेने

Financial Markets और Trading की दुनिया में, Technical Analysis Traders और Investors को Informative Decision लेने में मदद
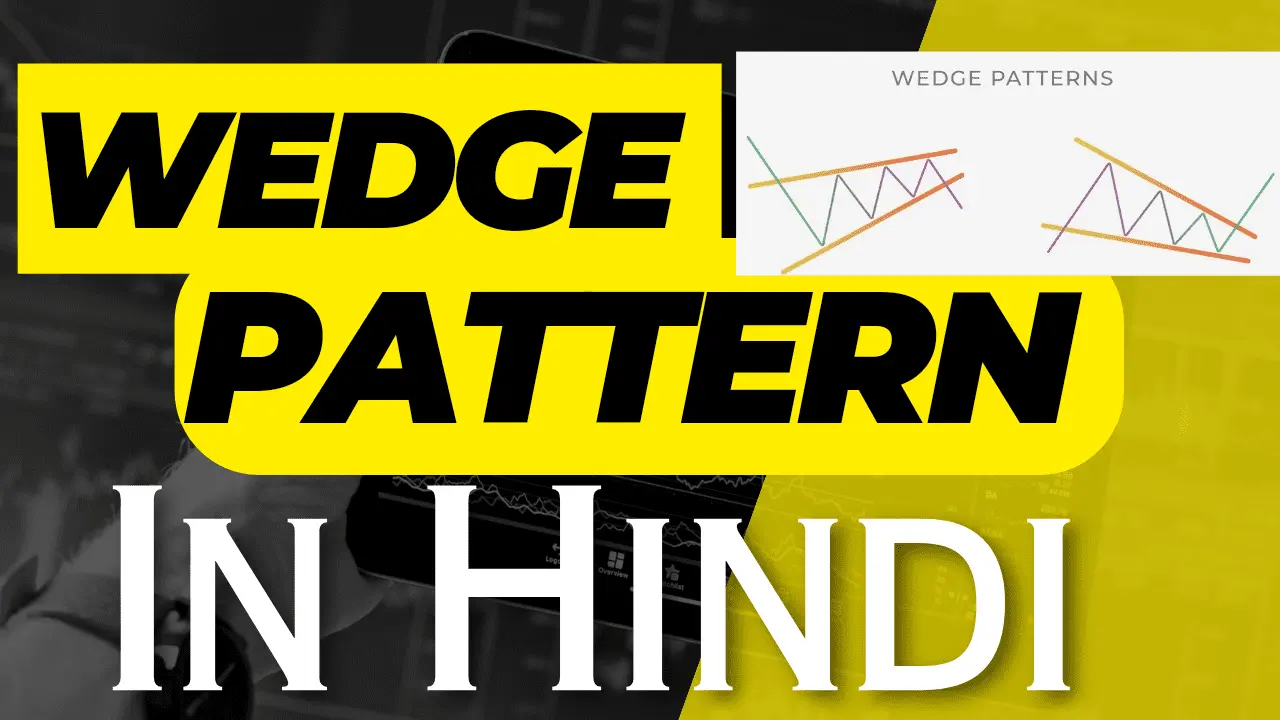
Chart Pattern, Wedge Pattern की तरह, Historical Price Movements का ही Graphical Represent करता हैं। वे Price Chart
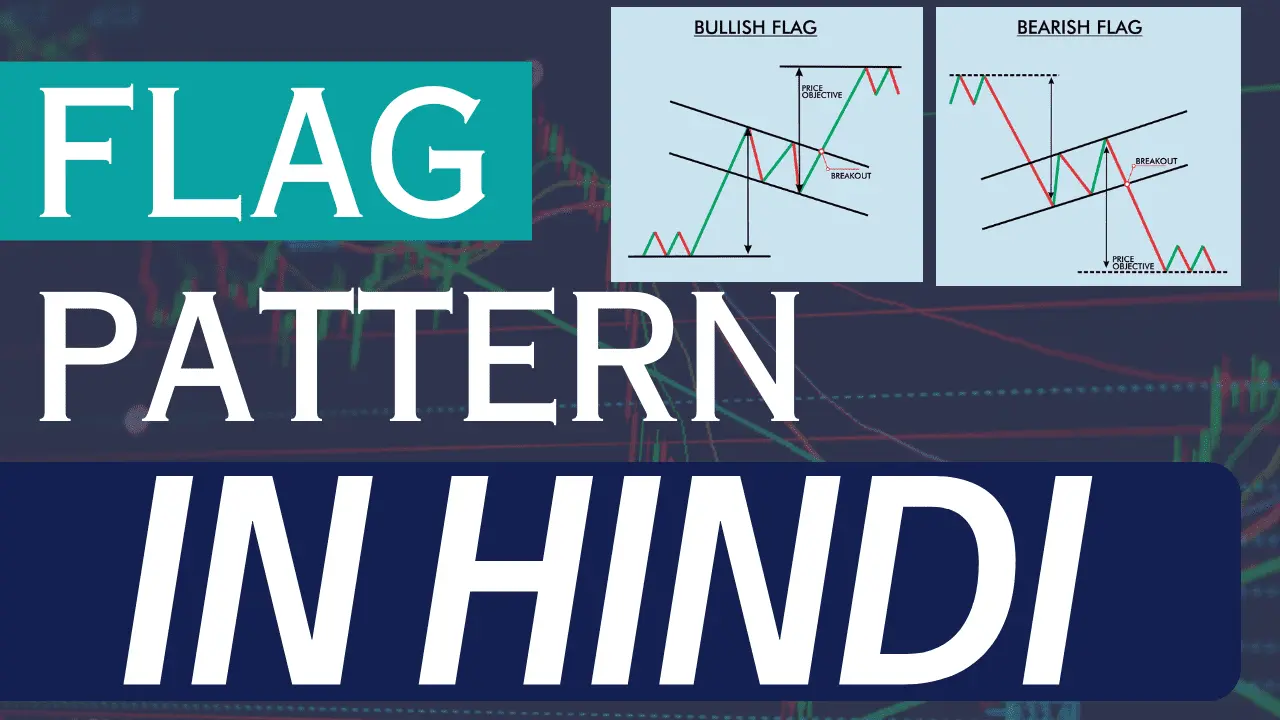
Trading में Flag Pattern एक Important और Normal Pattern हैं क्योंकि वे Valuable Insights और के बारे मे
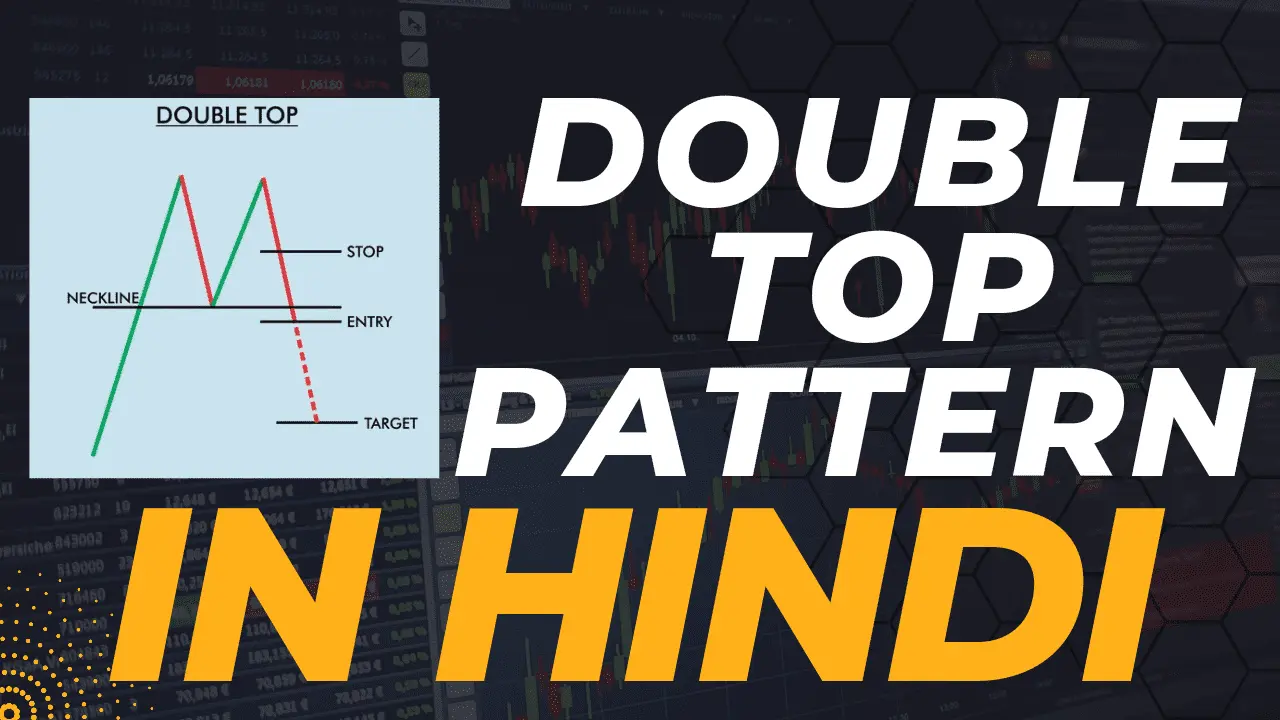
Financial Markets में Double Top Pattern देखा जाने वाला एक Normal Pattern है। यह एक Uptrend से Downtrend
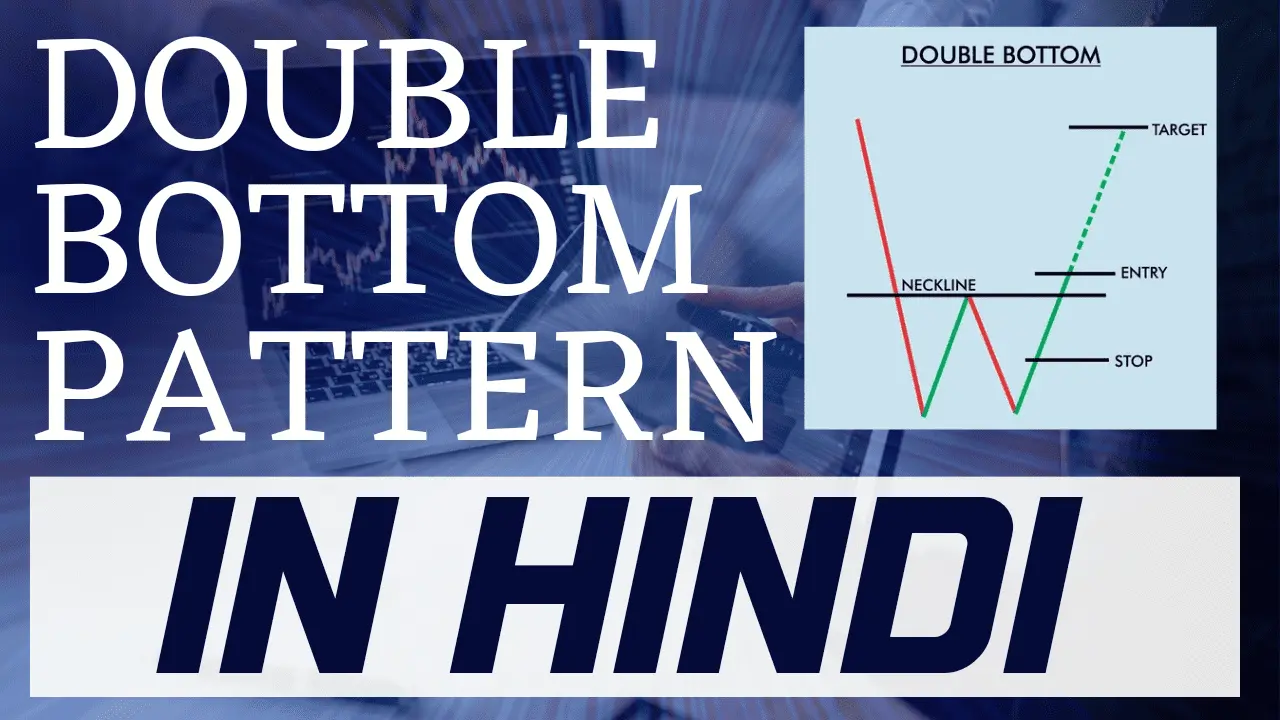
Double Bottom Pattern Technical Analysis में आमतौर पर देखा जाने वाला Chart Pattern है। इसे एक Bullish Reversal
