Chart Pattern Technical Analysis में Important Role निभाता हैं क्योंकि वे Traders और Investors को Market के Trend
Cup and Handle Pattern – 80% Potential Bullish Trend आयेगा
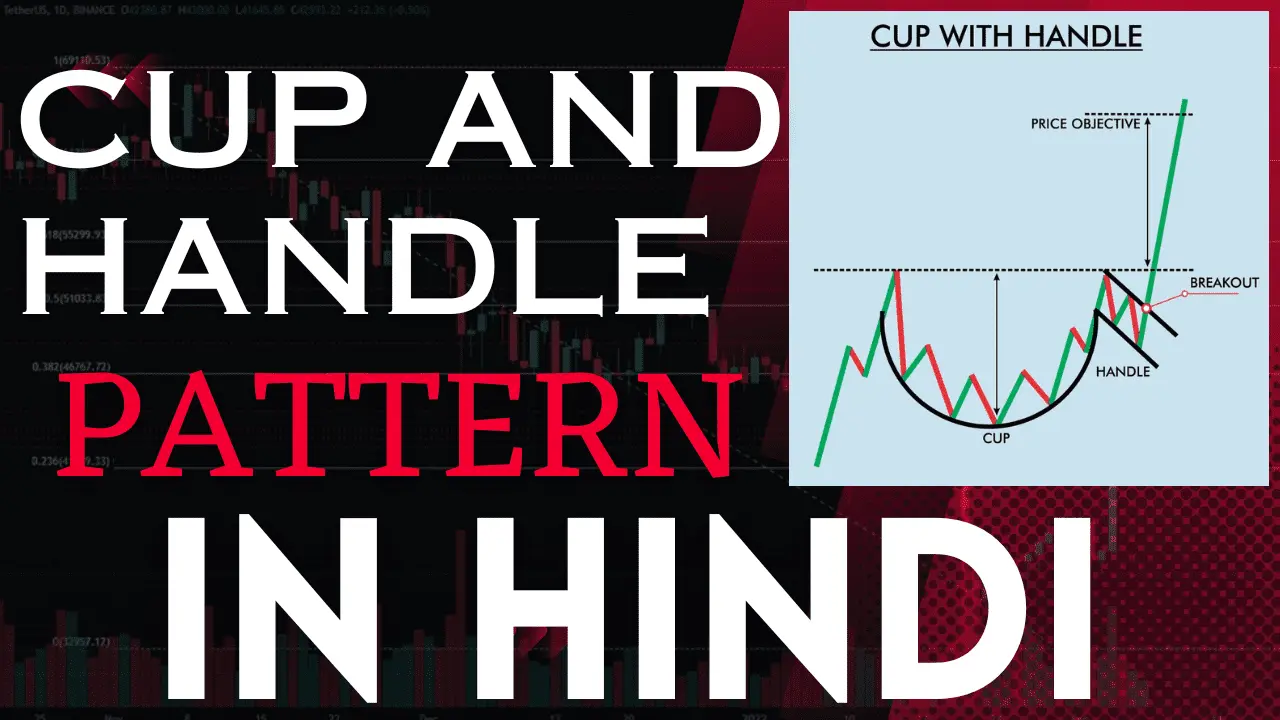
Chart Pattern Technical Analysis में Important Role निभाता हैं क्योंकि वे Traders और Investors को Market के Trend

Financial Markets में Traders की Success में Trading Psychology In Hindi एक Important Role निभाता है। इसमें उन
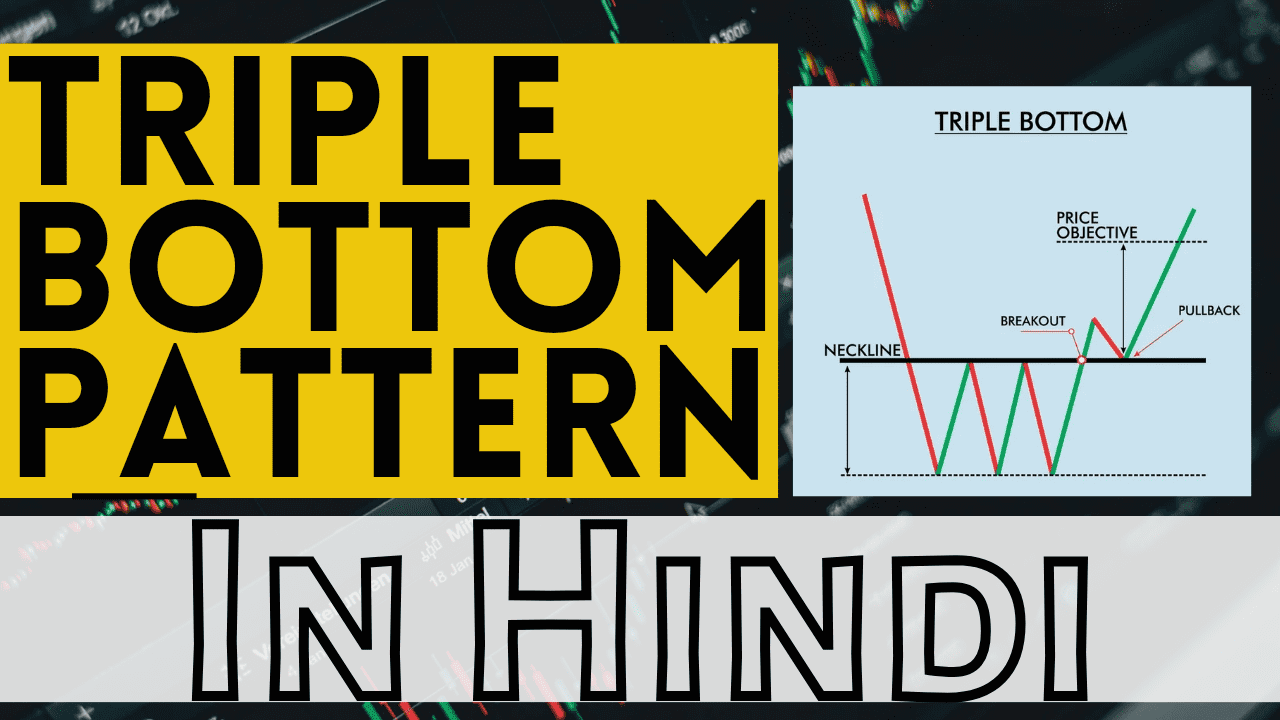
Triple Bottom Pattern एक Popular Chart Pattern है जिसका उपयोग Financial Markets में Potential Trend Reversal की पहचान

Chart Pattern Technical Analysis में एक Important Role निभाते हैं, जो Market के Trend और Potential Price Movements

Candlestick Pattern Financial Markets में Price Movements का एक Graphical Representation होता हैं। वे एक Specific Time Period
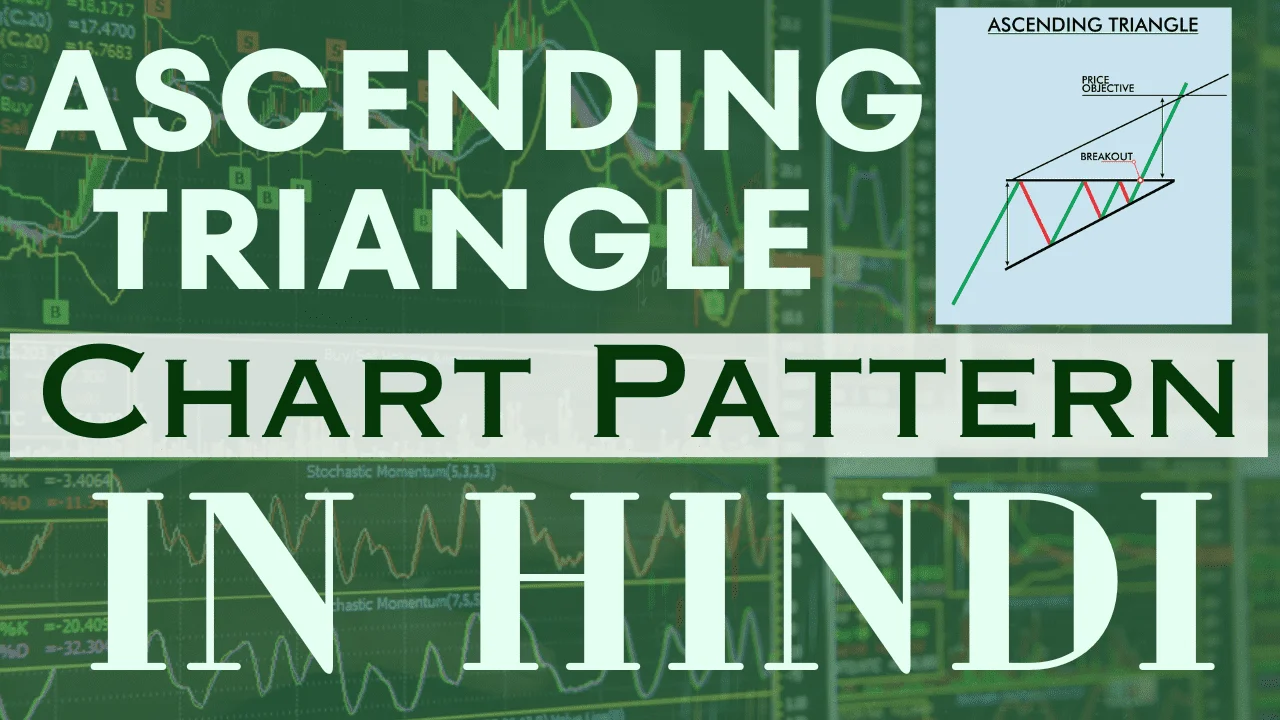
Technical Analysis में Chart Pattern एक Important Tool हैं, जो Traders को Potential Price Movement के बारे में
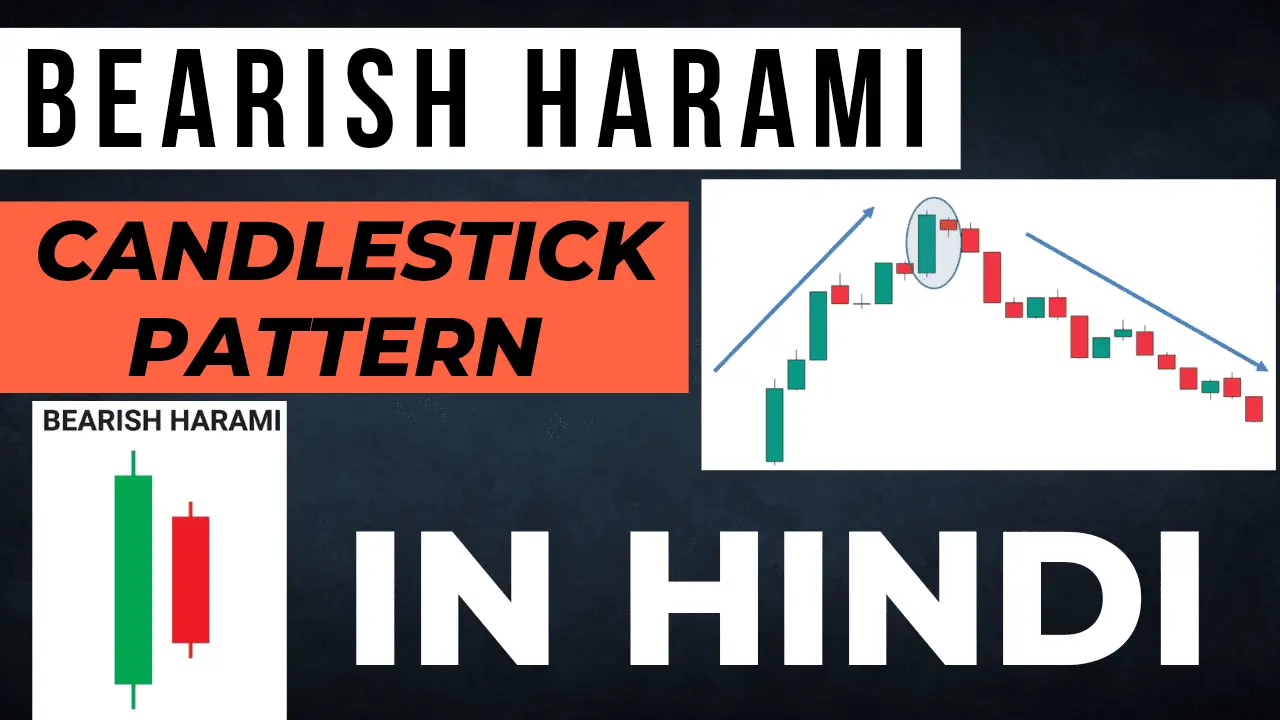
Candlestick Pattern Financial Market में Price Movement के Visual के रूप मे दिखाता हैं, मुख्य रूप से इसको

Candlestick Pattern Financial Markets के Analysis में एक Important Part रखता हैं, Market की Sentiment और Potential Price

Technical Analysis का Stock Market के Trends को समझने और Future के Price Movements की Prediction करने के

Candlestick Pattern Technical Analysis में एक Important Role निभाते हैं, Traders को Market के Trend और Potential Reversal